
Website speed impact is not a technical detail you hand off to a developer and forget. It is the difference between a visitor who buys and one who bounces to your competitor down the search results page. If your site takes longer than three seconds to load, you are already losing customers — and in Zambia, where most users arrive on mobile over a 4G or 3G network, that pressure is even sharper.
Quick answer: A slow website hurts Google rankings directly through Core Web Vitals signals, reduces organic traffic, raises paid-ad cost-per-lead, and suppresses sales conversion rates. Fixing page speed is one of the highest-return investments a small business can make — many improvements cost nothing but time.
This guide explains exactly how page speed affects your visibility on Google, what happens to your leads and revenue when load time climbs, and what you can do about it — whether you run a Shopify store, a WordPress site, or a custom-built platform. I have structured every fix with a DIY or “Needs Developer” tag, a realistic time estimate, and a cost range in both USD and Zambian Kwacha so you can plan your budget.
Why Website Loading Speed Is a Google Ranking Factor
Google’s mission is to serve the best possible result for every search query. A page that loads slowly delivers a poor experience, so Google treats load time as a quality signal. This is not speculation — Google has officially confirmed page speed as a ranking factor since 2010 for desktop and since 2018 for mobile.
The most precise version of this signal is now packaged in Core Web Vitals, a set of three measurements Google uses to assess real-world page experience. Think of them as a health check your doctor runs on three specific systems: loading speed, responsiveness, and visual stability. If any of the three scores poorly, your overall “page experience” grade falls, and that feeds directly into where Google places you in search results.
Let me break each one down in plain language.
Largest Contentful Paint (LCP) – How fast does the main content appear?
LCP measures how long it takes for the largest visible element on the screen to finish loading. On most business sites, that is your hero image, your main heading, or a large product photo. Google’s target is under 2.5 seconds. Between 2.5 and 4.0 seconds is flagged as “Needs Improvement.” Above 4.0 seconds is classified as “Poor.”
Think of it this way: a visitor lands on your homepage. LCP is the moment they actually see something meaningful, not just a blank white screen. Every extra second of staring at nothing increases the chance they leave.
Interaction to Next Paint (INP) – How quickly does the page respond to clicks?
INP replaced the older FID metric in March 2024. It measures how fast the page responds when a visitor clicks a button, taps a menu, or fills out a form field. Google’s target is under 200 milliseconds. A slow INP makes your site feel sluggish, like a phone with a cracked screen that takes two taps to register one press.
For e-commerce businesses, a slow INP on the “Add to Cart” button or checkout form directly reduces completed purchases.
Cumulative Layout Shift (CLS) – Does the page jump around while loading?
CLS measures visual stability. Have you ever been on a mobile site, started tapping a link, and the page suddenly shifted so you hit the wrong button? That is a high CLS score. Google targets below 0.1. Layout shifts happen when images load without pre-defined dimensions, or when ad banners pop in and push content down.
A high CLS score destroys user trust instantly and contributes to visitors leaving without taking any action.
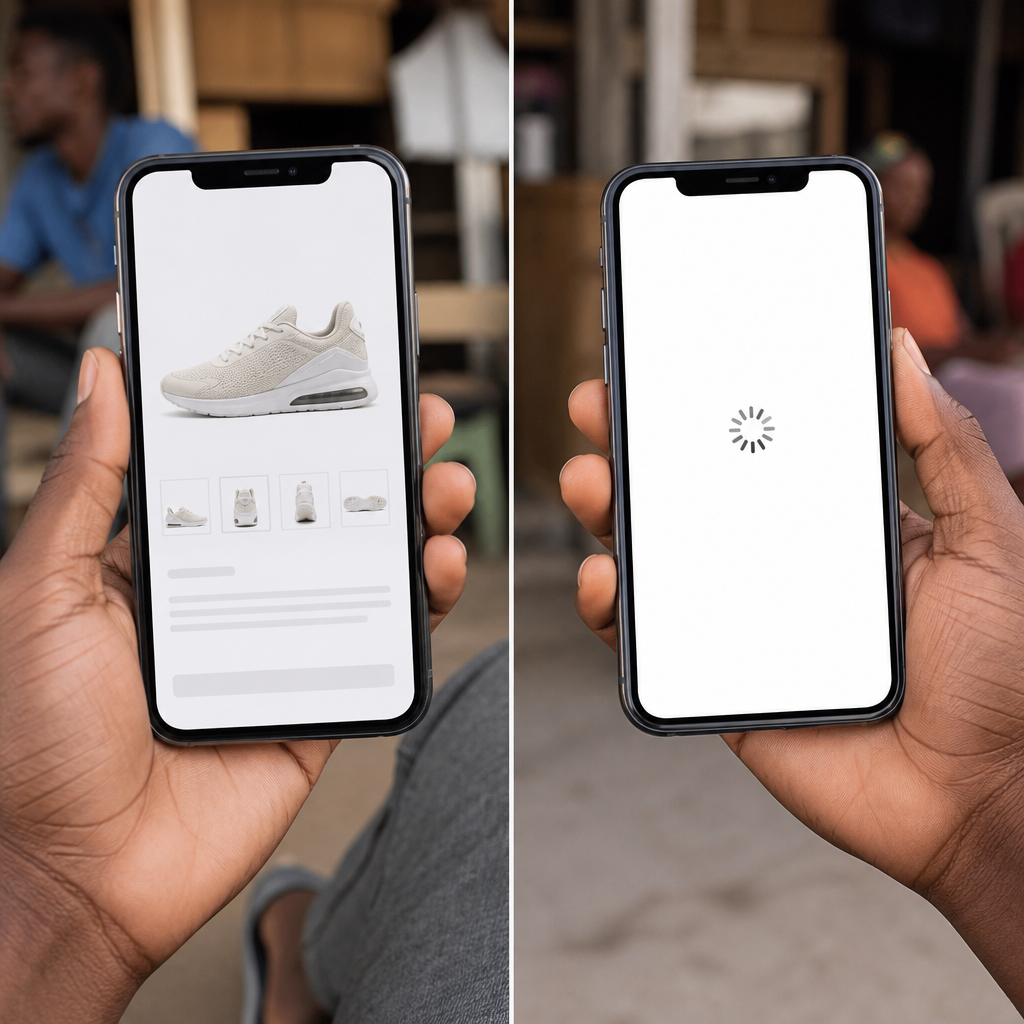
The Business Effect: What Slow Pages Actually Cost You
Google rankings are important, but the revenue loss from slow pages is often even more immediate and measurable. Here is how page speed affects your leads and sales in concrete terms.
Conversions drop sharply with every extra second
Research by Google and Deloitte (2019) found that reducing page load time by just 0.1 seconds improved conversion rates for retail sites by 8.4%. Portent’s 2022 study found that a site loading in one second has a conversion rate three times higher than a site loading in five seconds. These are not marginal differences — they represent thousands of dollars in lost revenue for a small business running at scale.
A practical example: if your site generates 200 leads per month at a 2% conversion rate and your load time drops from 6 seconds to 2 seconds, studies consistently suggest you could push that conversion rate closer to 4-5%, doubling your lead volume without spending a single additional kwacha on ads.
Paid advertising becomes more expensive
Google Ads uses a “Landing Page Experience” score as part of your Quality Score calculation. A slow landing page lowers your Quality Score, which forces you to bid higher to achieve the same ad position. A business spending ZMW 5,000 per month on Google Ads with a poor Quality Score might need to spend ZMW 7,000-8,000 to achieve the same volume of leads as a competitor with a fast page and a strong Quality Score. Speed fixes pay for themselves here very quickly.
Bounce rate, dwell time, and what Google actually measures
A common misconception is that “bounce rate is a Google ranking signal.” This is not accurate. Google has stated publicly that raw bounce rate from Google Analytics is not fed into its ranking algorithm. What does matter is the behavior pattern that slow pages create. When a page loads slowly, fewer visitors share it, fewer websites link to it, and fewer people return to it. It earns fewer backlinks, generates less engagement, and accumulates less positive user-behavior data over time. Those downstream effects are what Google’s systems detect and penalize. The slow page did the damage, but indirectly.
The Zambia-specific mobile reality
According to Ookla’s Speedtest Global Index (2024), Zambia’s median mobile download speed sits at approximately 20-25 Mbps on a good 4G connection, but real-world speeds in lower-coverage areas and during peak hours can drop to 5-10 Mbps. On a 10 Mbps connection, a page with 4MB of unoptimized images takes roughly 3.2 seconds just to transfer the image data, before the browser has even started rendering. Add DNS lookup time, server response time, and JavaScript execution, and a poorly optimized site easily hits 8-12 seconds on a Zambian mobile network. That is a customer who has already opened a competitor’s site before yours finishes loading.
Six Core Areas to Fix: DIY vs. Developer, With Costs in USD and ZMW
Most site speed problems fall into six categories. Work through these in order — the early fixes are free and have the highest impact.
1. Image Optimization
Tag: DIY | Time: 2-4 hours | Cost: Free (tools) to $10/month for automation
Images are the single biggest cause of slow load times for most small business websites. The fix is straightforward: compress images before uploading them and use modern formats.
- Convert JPG and PNG files to WebP format, which is 25-35% smaller with no visible quality loss. Use a free tool like Squoosh (squoosh.app) or TinyPNG (tinypng.com) before uploading any image.
- Set explicit width and height attributes on every image tag. This prevents layout shifts (CLS) because the browser reserves space before the image loads.
- Enable lazy loading so images below the fold only load when the visitor scrolls down. On WordPress, this is a one-click setting in most page builders. On Shopify, it is enabled by default in most themes from 2021 onward.
- For a Zambian business site, aim for your total page image payload to stay under 1MB. At 10 Mbps, that transfers in under one second.
Cost in ZMW: Free if you use Squoosh or TinyPNG manually. ShortPixel or Imagify for WordPress run approximately $5-10/month (ZMW 130-260/month at current exchange rates).
2. Caching
Tag: DIY (WordPress) / Needs Developer (custom sites) | Time: 1-2 hours | Cost: Free to $50/year
Caching stores a pre-built version of your page so the server does not have to rebuild it from scratch for every single visitor. For WordPress sites, install WP Rocket (paid, around $49/year, approximately ZMW 1,280/year) or LiteSpeed Cache (free) and enable page caching with a single toggle. These plugins also handle browser caching, which tells returning visitors’ browsers to store your CSS and JavaScript files locally so they do not have to re-download them on every visit.
For custom-built sites, your developer needs to configure server-level caching (Nginx FastCGI cache or Varnish). Budget approximately $100-300 (ZMW 2,600-7,800) for a one-time setup if your developer is billing hourly.
3. Hosting Quality
Tag: Needs Developer (migration) | Time: 1-3 days | Cost: $5-50/month
Your hosting provider is the foundation everything else sits on. Cheap shared hosting in a data center located in Europe or the US adds 300-600ms of latency for every Zambian visitor, before a single byte of your page loads. This is called Time to First Byte (TTFB), and it is invisible to most business owners but measured precisely by Google.
- For Zambia and Southern Africa: Consider hosting with providers that have African Points of Presence or data centers in Johannesburg (the closest major hub). Liquid Web Africa and RSAWEB host in Johannesburg. Cloudflare’s free CDN plan routes content from the nearest edge server, which meaningfully reduces latency for Zambian visitors even if your origin server is in Europe.
- Move off shared hosting if your site gets more than 500 visitors per month. A basic VPS or managed WordPress host (Cloudways, SiteGround) costs $10-25/month (ZMW 260-650/month) and delivers substantially faster TTFB.
- Enable a Content Delivery Network (CDN). Cloudflare’s free plan is a good starting point for any Zambian business. It caches static assets at edge servers globally and reduces load on your origin server.
4. JavaScript and Third-Party Scripts
Tag: Needs Developer | Time: 2-8 hours | Cost: Included in developer time
Every analytics tag, chat widget, social share button, and ad pixel you add to your site loads additional JavaScript. Each script can block the browser from rendering your page until it finishes executing. This is one of the leading causes of poor INP scores.
Steps your developer should take:
- Audit all third-party scripts using the “Coverage” tab in Chrome DevTools and identify which ones are render-blocking.
- Add async or defer attributes to non-critical scripts so they load after the page is visible.
- Remove scripts you no longer use. A Facebook Pixel from a campaign that ended six months ago is still slowing your site today.
- Load chat widgets (Tidio, Intercom) only after the page has fully rendered, using a delayed-load script.
Developer time for a script audit typically runs $100-250 (ZMW 2,600-6,500) for a small business site.
5. Fonts
Tag: DIY | Time: 1-2 hours | Cost: Free
Google Fonts are convenient but they add an external request that can slow down initial page rendering. Two quick fixes make a significant difference.
- Self-host your fonts: Download the font files from Google Fonts and serve them from your own server. This eliminates the external DNS lookup and connection. A free tool called “google-webfonts-helper” (gwfh.mranftl.com) generates the correct CSS and font files for download in two minutes.
- Add font-display: swap to your font CSS declaration. This tells the browser to show text in a system font immediately and swap to your custom font once it loads, instead of hiding text until the font is ready (which inflates LCP).
- Limit yourself to two font families maximum on any site. Every additional font is another file to download.
6. Mobile Performance
Tag: DIY + Needs Developer | Time: 4-8 hours | Cost: Free to $200
Google uses mobile-first indexing, meaning it crawls and ranks your site based on its mobile version. A site that looks fine on desktop but loads slowly on mobile is being ranked on its worst performance.
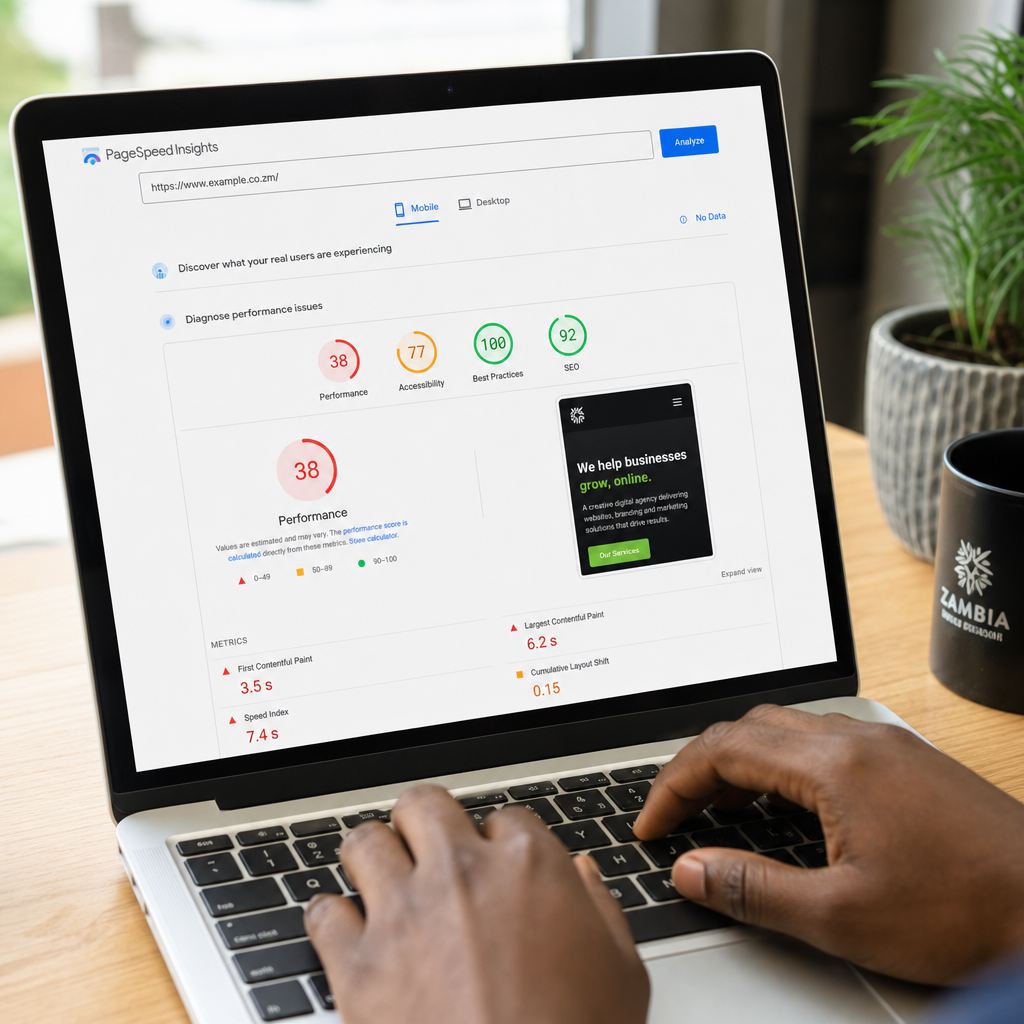
- Run your site through Google PageSpeed Insights (pagespeed.web.dev) using the Mobile tab. The score you see there is the one that matters most for rankings.
- Check that your theme or template is genuinely responsive, not just shrunk down. Responsive design adjusts layout, image sizes, and font sizes for the viewport — a shrunk desktop site forces mobile visitors to download full-resolution desktop images unnecessarily.
- Reduce the number of elements on mobile pages. A desktop sidebar with 12 widgets is dead weight on a 6-inch screen and costs load time with no benefit.
- Test on a real Zambian mobile connection by throttling your browser to “Slow 4G” in Chrome DevTools. This gives you an honest picture of what your customers experience.

How to Check Your Site Speed with Google PageSpeed Insights: Step by Step
PageSpeed Insights is free, takes about two minutes, and gives you a specific list of what to fix. Here is exactly how to use it.
- Go to pagespeed.web.dev in your browser. No account or login required.
- Enter your full URL including https:// and click “Analyze.” Use your homepage to start, then repeat for your most important landing page or product page.
- Switch to the Mobile tab first. This is the score Google uses for ranking. Note the overall score out of 100: 90-100 is Good, 50-89 is Needs Improvement, below 50 is Poor.
- Scroll to “Diagnostics” and look for red or orange items. These are your highest-priority fixes. Common ones include “Serve images in next-gen formats,” “Eliminate render-blocking resources,” and “Reduce unused JavaScript.”
- Check the Core Web Vitals section: LCP, INP, and CLS each show a pass/fail status. If any are red, click the item to see which specific element on your page is causing the problem. PageSpeed will name the exact image, script, or element responsible.
- Run the Desktop tab as well and note the difference. If your desktop score is 85 and your mobile score is 32, your mobile experience is your primary bottleneck.
- Screenshot your scores before making any changes. This gives you a baseline to measure improvement against after each fix.
Repeat this check monthly. Speed scores change as you add content, install plugins, or update your theme, so a page that scored 78 in January may score 61 in June if you added a new plugin or uploaded a large uncompressed image.
Shopify-Specific Speed Notes
If you run a Shopify store, you have some speed advantages built in — Shopify’s infrastructure is fast and globally distributed. But there are Shopify-specific issues that consistently hurt performance for store owners who are not watching closely.
Check your speed score in Shopify Admin
Go to Shopify Admin > Online Store > Themes. Shopify shows a speed score for your live theme, benchmarked against other Shopify stores. A score below 50 is a warning sign. Shopify calculates this using a sampling of your pages, so it reflects real-world performance more than a single PageSpeed test.
App bloat is the biggest Shopify speed killer
Every Shopify app you install potentially adds JavaScript and CSS to every page of your store, even pages where the app does nothing. A store with 15 apps often loads 15 extra scripts on every page view. Go to your theme’s code and check the theme.liquid file — you may find script tags from apps you uninstalled months ago that were never fully removed. Use PageSpeed Insights on your store and look at the “Reduce unused JavaScript” diagnostic to identify which scripts are loading unnecessarily.
Use Shopify’s Performance dashboard
Navigate to Shopify Admin > Analytics > Reports > Performance. This shows conversion rate by device type and session speed. If your mobile conversion rate is dramatically lower than desktop, slow mobile load time is the most likely cause. This dashboard also tracks how your store’s speed compares over time, so you can see the impact of app additions or theme changes immediately.
Optimize your Shopify theme
Stick to themes from the Shopify Theme Store that are explicitly marked as optimized for performance (Dawn, Debut, and Sense are good starting points). Avoid heavily customized themes from third-party marketplaces that bundle large JavaScript libraries. Every feature you do not use is code that still loads.
The Paid Ads Cost-Per-Lead Example
Here is a worked example that makes the financial case concrete.
Imagine a Lusaka-based business spending ZMW 5,000 per month on Google Ads. Their landing page loads in 7 seconds on mobile. Their Google Ads Quality Score is 4/10 due to poor landing page experience. With a Quality Score of 4, they pay a cost-per-click penalty of approximately 400% above the base bid. Their effective cost-per-click is ZMW 8. Over the month, ZMW 5,000 buys them 625 clicks. At a 1.5% conversion rate on a slow page, that generates approximately 9 leads. Cost per lead: ZMW 556.
Now the same business optimizes their landing page to load in 2.1 seconds. Quality Score improves to 7/10. Their cost-per-click drops to approximately ZMW 4.50 (a 44% reduction). ZMW 5,000 now buys 1,111 clicks. At a 3.5% conversion rate on a fast page, that generates approximately 39 leads. Cost per lead: ZMW 128. The same ad budget, a 4x increase in leads — entirely driven by page speed and landing page experience.
This is not a hypothetical. Google’s own research and independent studies from agencies like WordStream consistently show this pattern. Speed is arguably the most underspent optimization lever in digital advertising for small businesses.
Key Takeaways
- Website speed impact is officially measured by Google through Core Web Vitals (LCP, INP, CLS) and directly affects your search ranking position.
- Slow pages do not hurt rankings through bounce rate directly — they hurt rankings by suppressing backlinks, engagement, and return visits over time.
- In Zambia, where mobile speeds can drop to 5-10 Mbps in real conditions, image optimization and a CDN are the highest-priority fixes for most businesses.
- Image compression and font self-hosting are free, DIY fixes that can cut load time by 30-50% on image-heavy sites.
- Shopify store owners should audit app scripts, check the Admin speed score, and use the Performance dashboard monthly.
- Fixing page speed can reduce your Google Ads cost-per-lead by 50-75% by improving Quality Score and conversion rate simultaneously.
- Use Google PageSpeed Insights (mobile tab) monthly as your baseline measurement tool. It is free and names exactly what to fix.
- A structured performance audit by an experienced developer typically costs $200-600 (ZMW 5,200-15,600) and pays for itself within one to two months of improved ad efficiency and organic traffic.
Conclusion: Treat Speed as a Business Investment, Not a Technical Task
A fast website is not a luxury for large companies with big development budgets. It is a basic requirement for any Zambian or African business competing for customers online. Your competitor’s site loads in 2 seconds. If yours takes 8 seconds, the visitor does not wait — they go back and click the next result. That is a customer you paid for through SEO effort or ad spend, gone before they even saw your offer.
Start with the free fixes today: compress your images, self-host your fonts, and run a PageSpeed Insights check on your mobile score. Note your current scores. Then work through the caching and script fixes, or bring in a developer for the hosting and JavaScript audit. Each layer of improvement compounds on the previous one.
If you want a complete picture of where your site stands, our team offers a professional website performance audit that covers all six areas above, benchmarks your Core Web Vitals against competitors, and delivers a prioritized fix list with cost estimates. We work with businesses across Zambia and the broader Southern Africa region and understand the specific hosting and network constraints that affect performance here.
You can also explore our website development services if you are considering a full rebuild optimized for speed from the ground up, or our Shopify store setup service if you want a performance-first e-commerce presence without the complexity of a custom build.
Run your PageSpeed Insights check right now. Note your score. Then reach out — we can help you close the gap between where you are and where you need to be.
FAQ
Does website speed directly affect Google rankings in 2025?
Yes. Google uses Core Web Vitals (LCP, INP, and CLS) as direct ranking signals through its Page Experience update. Sites that score poorly on these three metrics are at a disadvantage in search results compared to faster competitors targeting the same keywords. Speed has been an official ranking factor since 2010 for desktop and 2018 for mobile.
What is a good website load time for SEO and conversions?
Google targets an LCP (Largest Contentful Paint) of under 2.5 seconds for a Good rating. For overall page load, studies consistently show that pages loading in under 2 seconds convert significantly better than those loading in 4 or more seconds. For Zambian mobile users, aim for under 3 seconds on a simulated 4G connection.
How does slow page speed affect lead generation?
Slow pages reduce conversion rates, increase the cost-per-lead from paid ads by lowering your Google Ads Quality Score, and suppress organic traffic over time by earning fewer backlinks and less engagement. Research by Portent (2022) found conversion rates on 1-second pages are up to 3 times higher than on 5-second pages.
What is the fastest way to improve website speed for a small business?
The three highest-impact free fixes are: compress and convert all images to WebP format, enable page caching (WP Rocket or LiteSpeed Cache for WordPress), and self-host your Google Fonts. These three changes alone can reduce load time by 30-50% on most small business sites without any developer involvement.
How do I check my Core Web Vitals for free?
Go to pagespeed.web.dev, enter your URL, and run an analysis. Switch to the Mobile tab first, as this is the version Google uses for ranking. The report shows your LCP, INP, and CLS scores with pass or fail status and names the specific elements causing any failures, so you know exactly what to fix.
Does website speed matter more in Zambia than other markets?
Yes, relatively speaking. Zambia's real-world mobile speeds can drop to 5-10 Mbps in lower-coverage areas (Ookla 2024 data), meaning unoptimized images and heavy JavaScript cause far longer load times than they would on a 50 Mbps European connection. Image optimization, CDN use, and hosting with a Johannesburg-based data center have outsized impact for Zambian audiences.
Is bounce rate a Google ranking signal?
No. Google has confirmed that raw bounce rate from Google Analytics is not a direct ranking signal. However, slow pages create patterns that do affect rankings indirectly: fewer backlinks, less social sharing, shorter dwell times, and fewer return visits. These downstream behaviors reduce a page's authority and visibility in search results over time.